Appearance
Project view and layers
Geolitix is designed to be a central platform for analyzing, visualizing and collaborating on near-surface geophysical data. The Geolitix platform is designed similar to a GIS software package, where each element of a project is contained within a project layer. New layers can be added using the  icon and existing layers can be expanded to reveal options for that layer.
Layer management
Layers can be re-ordered to place them in an optimal stack on your project view. 
Layers can also be duplicated, which is useful when experimenting with different horizon interpretations or complex pipe layouts. 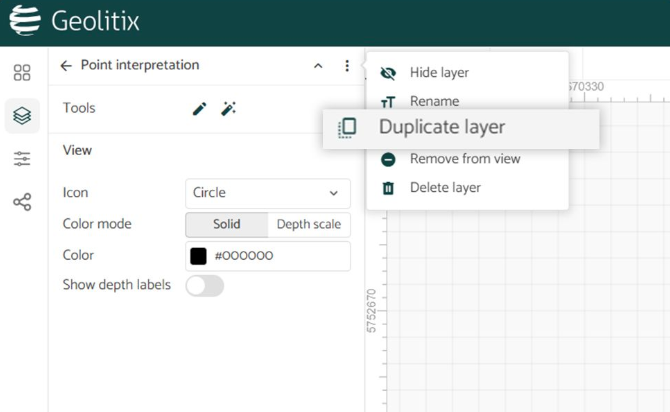
In additions, layers can be grouped into folders, which themselves can be made visible or invisible. This is particularly useful when a complex project may have dozens of pipes and cable types which need to be organized. Folders can be nested, similar to GIS software. 
A project can have multiple GPR profiles layers as well. This is particularly useful when a single project uses different GPR systems from different manufacturers or different antennas. Dual frequency and dual polarisation antennas are always imported together and are handled in one GPR profile layer automatically.
Geolitix is continually evolving based on new concepts, new technologies and user feedback. Previous versions of the Geolitix platform included Tabs which separated functionality, such as Profiles, World, etc. These tabs were concatenated into a single screen and were deprecated in December, 2023.
2D mode
In 2D mode  , all data, maps, overlays and interpretations are displayed in plan view (top down). Similar to a GIS application, the various layers within the map can be re-ordered by dragging the dropping a layer on the left side bar.
3D mode
When the 3D mode  is active, a series of additional options are displayed. Selecting the Vertical option displays further options.
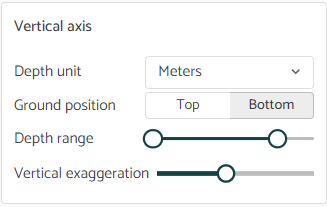
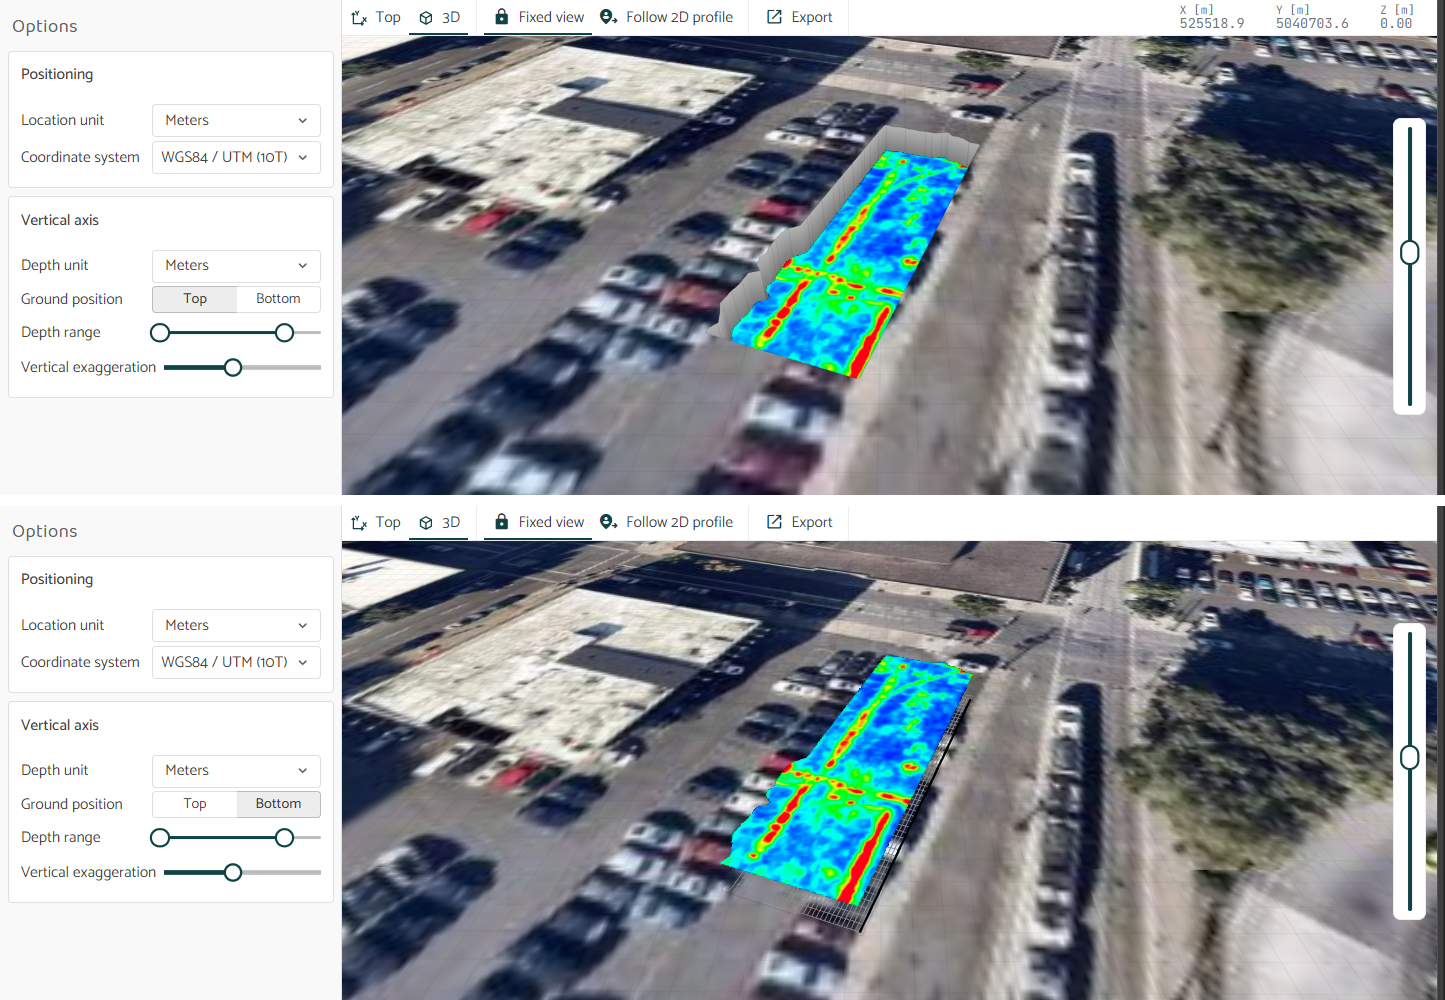
The Ground position can be selected to be either at the top of your model (i.e. data and interpretations are displayed under the ground inside a “pool” or at the bottom (i.e. data and interpretations float above the ground. The images below illustrate the difference between the ground being at the top (above) and at the bottom (below) of a GPR model.
The Depth range is used to control where the ground plane appears in the model (maximum value) and where the model is cut at the top. By default, it appears at the maximum depth of your radar profiles. However, if a time cut process has been applied, the max depth should be brought upwards to match the bottom of the trimmed radar profiles. Trimming minimum value of the Depth range is useful in removing surface clutter from 3D isosurface models
The vertical exaggeration of the model can be changed using the slider.
Zoom levels and tracking cursors
In both 2D and 3D views, the map view can be set using the Fixed view icon  to show a specific zoom level, which is set using the mouse scroll wheel. In this mode, the map is locked to the extents set with the mouse scroll wheel.
It is often needed to zoom in on specific parts of the 2D or 3D map. To avoid having to move the map when working on large projects with long profiles, the Follow 2D profile mode  is used. This mode moves the 2D or 3D map at the zoom level set by the mouse scroll wheel to match the location of the GPR profile being viewed.
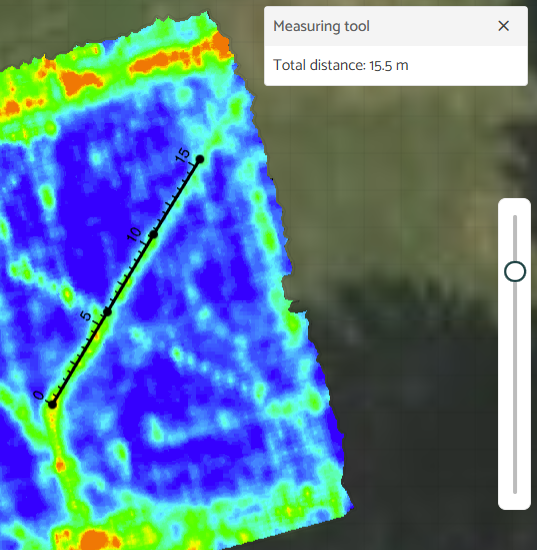
Distance measuring tool
Right clicking anywhere on a 2D map will enable the Measure distance tool. This ruler can be used to measure the distance along any path with multiple segments and display its distance in the project units.