Appearance
Positioning Non-GPS Projects
The quality of your GPR data and results is only as good as the positioning method used to collect the data. Often, poor planning on grid layouts results in very clear data being unusable once back in the office.
It is important to note that nothing done within Geolitix cannot be undone at any time. Even upon completion of the project, if a mistake is noted, you can easily go back to the positioning tab of the GPR layer to change something and that change will propagate throughout the rest of the processing and interpretation steps automatically.
In general, there are two types of GPR projects: those that are positioned using a grid of some sort (one-directional, two directional, etc) and those that are positioned using a tracking system such as GPS or a total station in a freeform path, which itself could be in a grid pattern. The distinction is that grid surveys rely on a wheel odometer for distance and positioning and GPS surveys rely on a GPS or total station of positioning.
Grid surveys using a wheel odometer (with equally spaced traces) can take many forms and variations, although they will all be created based on some Cartesian grid of x and y axes.
Malå ObjectMapper OBJ, IDS C-Thur, some Sensors and Software GPZ, and some Proceq projects include grid parameters describing how they were collected in the field, that are automatically imported when uploading the files. Any other datasets can be manually positioned following the instructions on this section.
Basic concepts
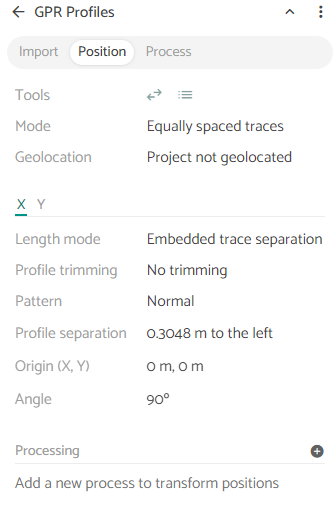
After importing the project files, we can position them within the GPR layer using the Position tab.
Line colors
The line color represents the direction in which the collection of the data was done. The beginning of the line is represented with green and the end with red.
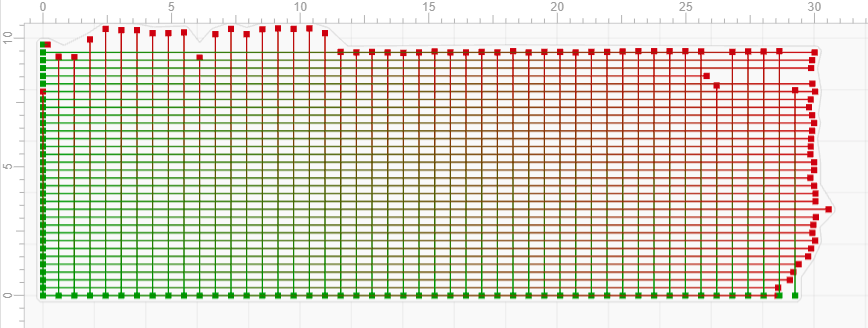
Square colors
Geolitix supports reversing the direction of the profiles. This functionality is particularly useful for profiles collected in two directions (back and forth).
The direction in which the profiles are going to be shown on screen is represented by the color of the squares at the end of the lines. A green square represents the beginning of the profile (on screen) and a red square the end.
Profile length
There are several options to determine the length for the profiles.
| Mode | Description |
|---|---|
| Trace separation | Manually input a fixed trace separation |
| Embedded trace separation | Use the trace separation -usually from the odometer- in the file header (Not always available) You can add a correction factor in case that the odometer isn't correctly calibrated. |
| Trace density | Manually enter the number of traces per meter or per foot |
| Profile length | Manually enter the total length of the profiles |
| Marker positions | Determine the length of the profiles based on markers added during data collection |
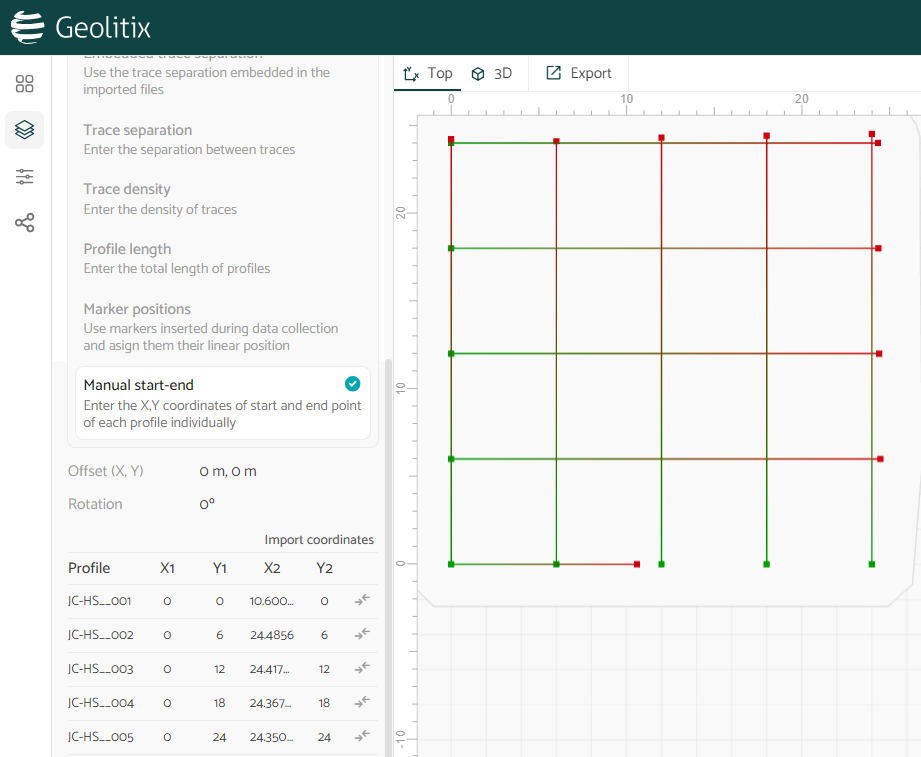
| Manual start-end | Enter in the start and end coordinates for each profile or import a spreadsheet with start and end coordinates |
Trimming profiles
Sometimes a GPR profile was acquired further than intended. Using the Trim extra option the profiles can be trimmed to any distance required.
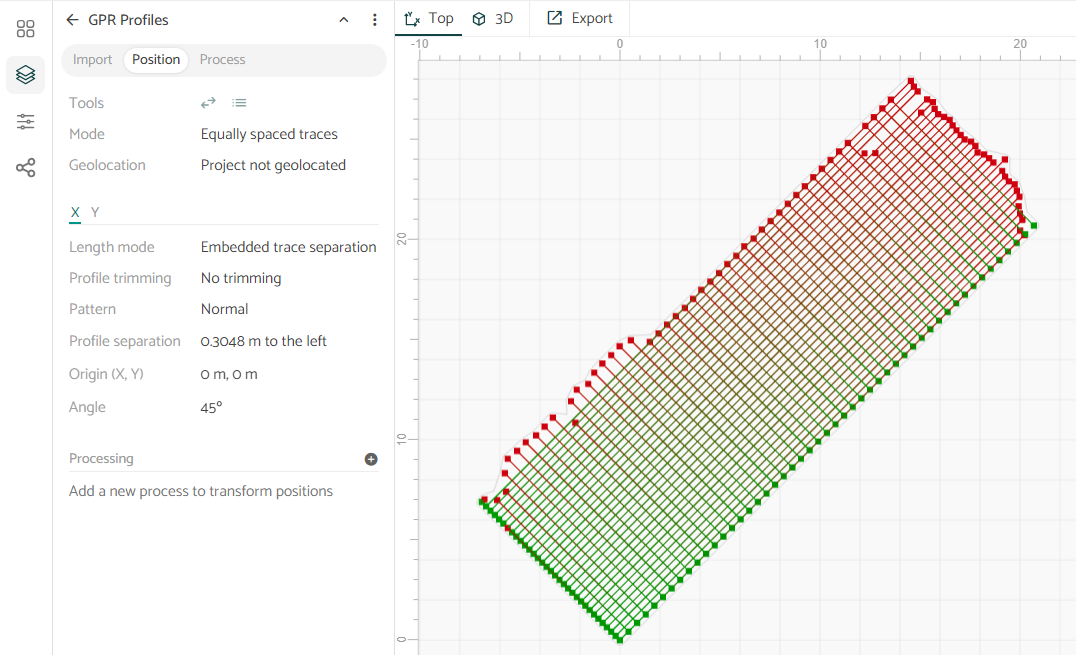
Rotating profiles
To change the angle of the profiles simply enter it in degrees in the Angle textbox. A 0º angle means that it is pointing north.
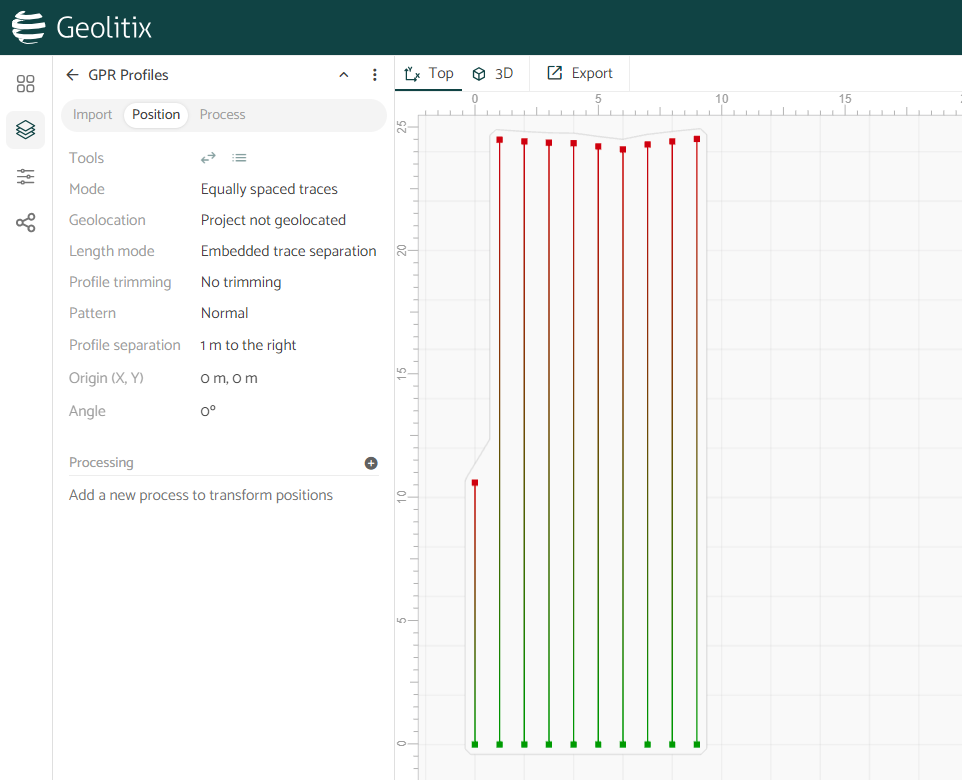
Profile separation
Most GPR surveys involve scanning areas rather than single profiles. One possible grid pattern is a series of equally-spaced profiles along one axis and in the same direction.
Before entering a profile separation, all profiles are shown in the same position. We can set the separation between profiles in the Profile separation box.
By clicking a profile, we see the profile’s name at the upper right corner of the screen.
TIP
If you want to change the direction in which the profiles are added (i.e. subsequent profiles should be added to the left when looking at them in the direction of travel instead of right) Simply change the profile separation to a negative value.
Grids with reversed profiles
Often, for efficiency, GPR grids are collected in a back-and-forth pattern. Geolitix has various options for these types of grids, they can be selected from Pattern.
- Normal: All profiles were collected starting on the same baseline
- Reverse even/odd (By reverse distance): Every second profile is reversed and these reversed profiles start at a user-set distance from the baselin
- Reverse even/odd (Returns to same baseline): Every second profile is reversed and these reversed profiles end at the same baseline where the non-reversed profiles start
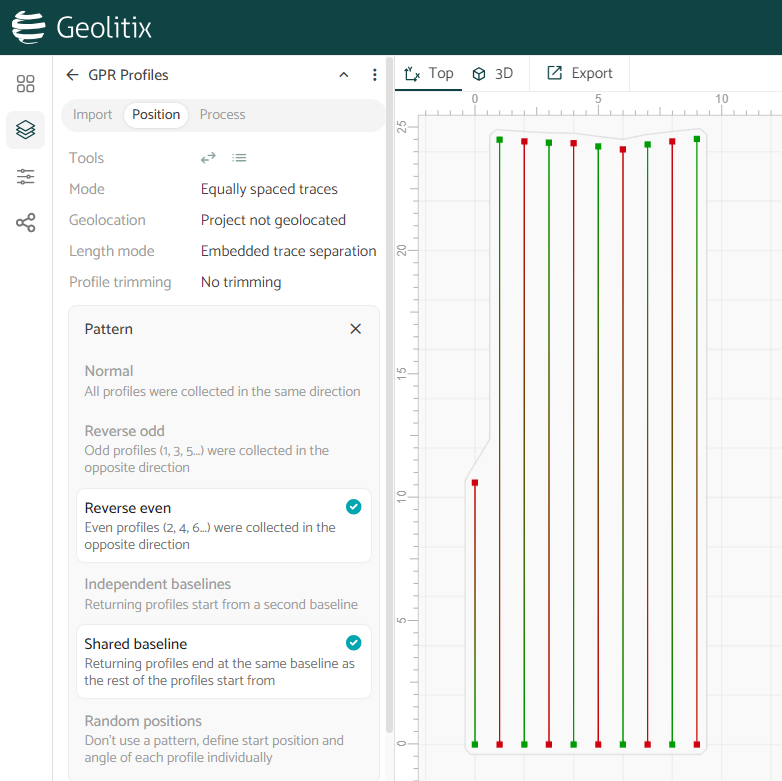
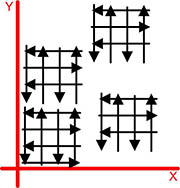
Note the colors on the map above. The green to red lines indicate the direction the lines were originally collected in the field, and the green and red squares indicate the direction that they will be displayed in Geolitix. This allows you to quickly ensure that all profiles are oriented properly.
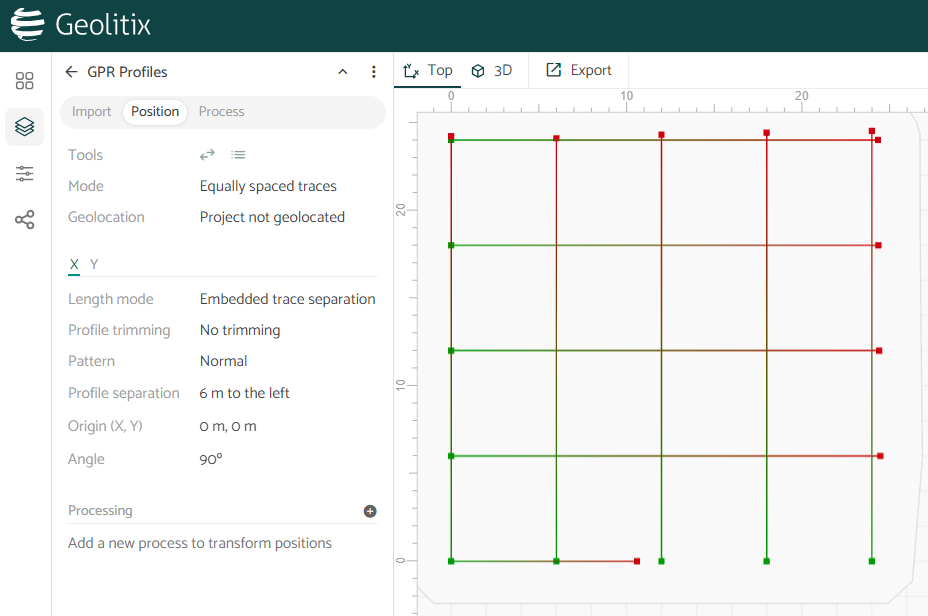
Bi-directional grids
GPR surveys are commonly carried out in two directions. Geolitix handles these situations with ease using folders.
When uploading files, profiles which were collected in the x direction may be placed in a folder called X, and those in the y in a folder called Y. Any other names may be used.
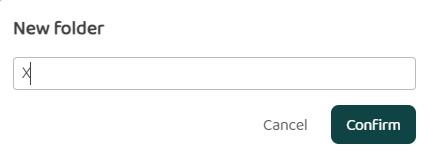
The folders may be created after all the data have been uploaded. The appropriate profiles may then be moved together into their specific folder.
Within the Positioning tab, each folder has its own positioning parameters, as described above. In this case, the parameters are similar, except for the angles used (0º and 90º).
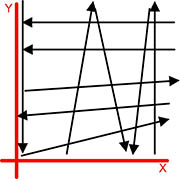
Irregular grids
Often, a mistake is made in the field whereby for example some lines are either re-done in the wrong direction, or obstructions don't allow us to collect a regular grid.
There are two ways to account for this on Geolitix:
Disable line pattern. This action will hide the line pattern options. The positioning of the profiles will now be done based on X-Y-angle coordinates for each individual profile.
Use manual start-end mode. The positioning of the profiles will now be done based on start and end X-Y coordinates for each individual profile.
When turning off the Line pattern button, Geolitix will ask you if you wish to either completely ignore the current Line pattern or Calculate coordinates based on the current pattern. Calculating coordinates can be useful in cases where the grids almost follows a regular pattern, the individual coordinates will be calculated based on the current pattern and then you can modify them as needed. In the next example we wish to reverse Profile 3, which started at x=58.6, y=10 and progressed to the left, which means an angle of -90° degrees (or 270°).
TIP
In general, all profiles in a grid should be displayed in the same direction (i.e. green squares on one side) to simplify interpretation. We can reverse the direction that Geolitix will display the profile with the reverse button.
Importing spreadsheet with profile coordinates
Complex grid patterns can be created using the start and end points for each profile. This can be done in two ways using a CSV or XLS spreadsheet containing the start and end points for each profile on each row, or a row each for the start and end points.
- Step 1: Select Manual start-end under Mode.
- Step 2: Click settings. Select the
 icon
icon - Step 3: Select the
 icon to upload a CSV or Excel XLS file
 - Step 4: Select the correct mode, and edit the column assignment if necessary
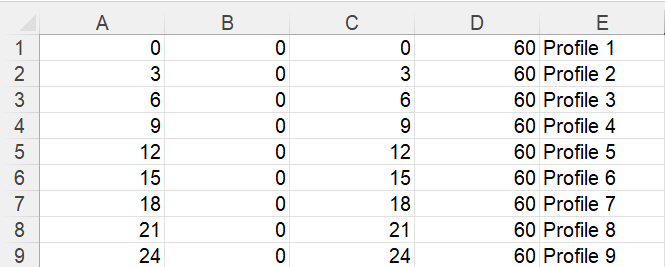
Start and end in same row
Using this mode, both start and end points should be in the same row. An example spreadsheet is shown below.
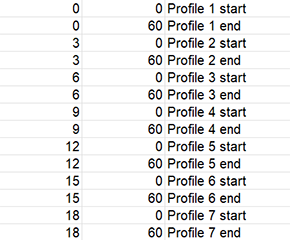
One point per row
Using this mode two rows per profile are required. An example spreadsheet is shown below
Geolitix will attempt to match the filenames in the spreadsheets to the GPR profiles in your project. If an exact match is not found, you can select which profile each row of the spreadsheet relates to manually.
Multiple grids
Large projects sites may require multiple grids of different sizes and shapes.
Similarly as handling bi-directional grids, this case can be addressed using multiple folders. Each folder would contain one directional of lines from one grid. For example they could be named Grid01X, Grid01Y, Grid02X, etc.
Complex layouts
For some surveys, a complex layout of GPR profiles is required due limitations of site access and obstructions. These types of surveys are often collected by marking the start and end points of each GPR profile on the ground and later returning with an accurate RTK GNSS or total station to pick up those locations. As such, a spreadsheet can be created with a row for each GPR profile and its starting and ending positions (x,y) and then entered manually using the manual start-end mode, or importing them from a file