Appearance
Boreholes
Borehole lithologies and geochemical assay (concentration) results can be displayed in Geolitix in both 2D and 3D. Drilling information is often used to assist in geophysical interpretation or to calibrate radar velocities.
To assist in formatting the borehole logs, a pre-formatted template can be downloaded. The x and y coordinates should be in the same coordinate system as other imported data. Multiple borehole datasets can be loaded into one Geolitix project.
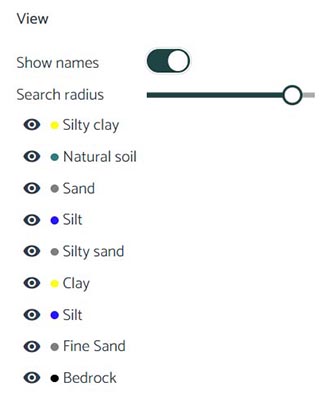
Upon importing a borehole file, a series of options are provided. You are asked if the borehole name should be shown on the plan map in the map view. You can then select a radius to search for the nearest boreholes, from 0 m to 20 m away from the nearest GPR profile. A color can be selected for each type of lithology listed.
If assay (chemical or other material concentrations) results are included on the drilling log, you can select which assay to display. Assays are shown adjacent to the borehole data as a bar plot in both 2D and 3D views.