Appearance
Point Interpretations
Adding a point interpretation layer allows you to place points on GPR profiles, both on 2D and 3D.
Create new point objects using the  icon.
icon.
Points can be clicked and dragged to modify their positions. Clicking on an existing point will delete that point.
You can select the color and shape of the interpreted points. In addition, rather than a solid color, the interpreted points can be displayed on a rainbow depth scale to assist in ensuring that the correct pipe is being interpreted at a consist depth.
Point interpretations may be exported using the  icon in CSV format. Note that the output files are tab-delimited when importing into other software.
Auto-pick hyperbolas
Geolitix has an artificial intelligence algorithm built-in which attempt to automatically pick hyperbolas for pipes and rebar. This approach uses computer vision to search GPR profiles for objects which most resemble hyperbolas. The use of computer vision for automatic picking in GPR is ideally applied to very clean datasets which minimal geological noise and good penetration. No amount of AI or computer vision can pick out hyperbolas which either are so obscured that the human eye can’t see them or are so buried in clutter that they can’t be interpreted.
It is sometimes suitable to allow the AI algorithm to pick initial points along each profile. These points can be reviewed, and extraneous points can be deleted by hand. To use the AI algorithms, select the  . A new panel on the left side bar appears.
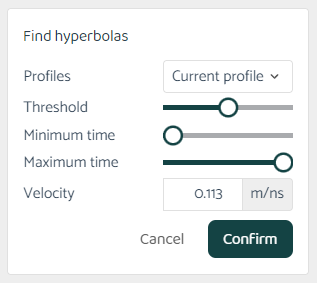
You can select the scope of the AI algorithm detection, be it the current profile, the current folder, or an entire project. The threshold slider effects the sensitivity of the algorithm. Too low a number would pick nearly every bright spot which resembles a hyperbola to be picked, resulting in too many extraneous points. Conversely, too high a threshold would result in only the most clear and obvious hyperbolas to be picked.
The minimum and maximum times are used to narrow the search area to only the time or depth window. This is most useful when interpreting specific layers of rebar. The velocity box allows you to fine-tune the shape of the hyperbolas being searched for. This is automatically filled with the project velocity.
Adaptive interpretations
Any changes to the time scale of the GPR profiles (e.g. time zero, time cut, flatten to horizon) are automatically reflected in the time/depth of all point interpretations.