Appearance
GPR Visualization Options
This section covers the various options available for visualizing GPR profiles in Geolitix. These visualization tools help you analyze subsurface data more effectively by providing flexible display options, color schemes, and multi-profile viewing capabilities.
Switching between profiles
When displaying GPR profiles in 2D or 3D mode, you can change to the next or previous profiles by using the  icons at the top of the screen. Alternatively, pressing ALT + 1 and ALT + 2 will cycle through the radar profiles as well.
View panel
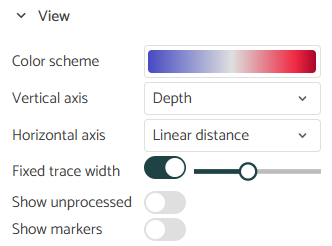
The View pull down menu offers multiple options on how each GPR profile is displayed on the screen in Geolitix.
All settings in View are part of your project preferences and will be saved with it.
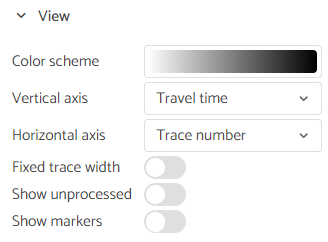
Changing the GPR profile colors
Geolitix allows you to select from various color schemes for your GPR data. Although a standard greyscale will be shown in all examples, you may select from 12 color schemes. Each of these can be mirrored or reversed using the  and
and  icons.
Vertical axis
The Vertical axis pull down allows you to display data with a two-way travel time, depth or elevation as the y-axis. To display data in depth, a project velocity must be set.
Horizontal axis
By default the x-axis on the profiles shows the trace number. Enabling this option will switch the axis to linear distance. Note that if the positioning was done based on GPS, in order to see the linear distance mode, a Resample Traces Equidistantly processed must be applied first.
Zooming and scrolling GPR profiles
The default viewing mode is to allow the data to be zoomed horizontally using the mouse scroll wheel. However, you can set the trace width to be locked at a selectable number of pixels. In this mode (Fixed trace width), the mouse scroll wheel pans the radar profile left and right on the screen.
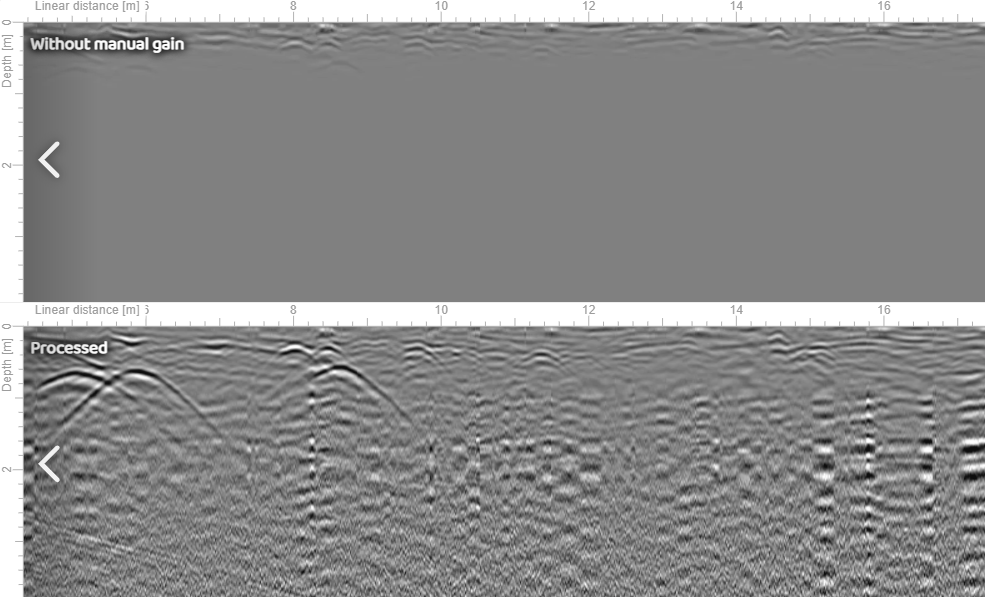
Show unprocessed
If this option is on, the profile view will be split to show the data before (above) and after (below) processing, when a processing step is selected.
Show markers
Some GPR manufacturers allow markers to be inserted into their GPR data. With this options they will be shown as a vertical red line.
Stacked profiles
Multiple adjacent GPR profiles can be displayed simultaneously to facilitate tracking linear targets such as pipes and rebar.
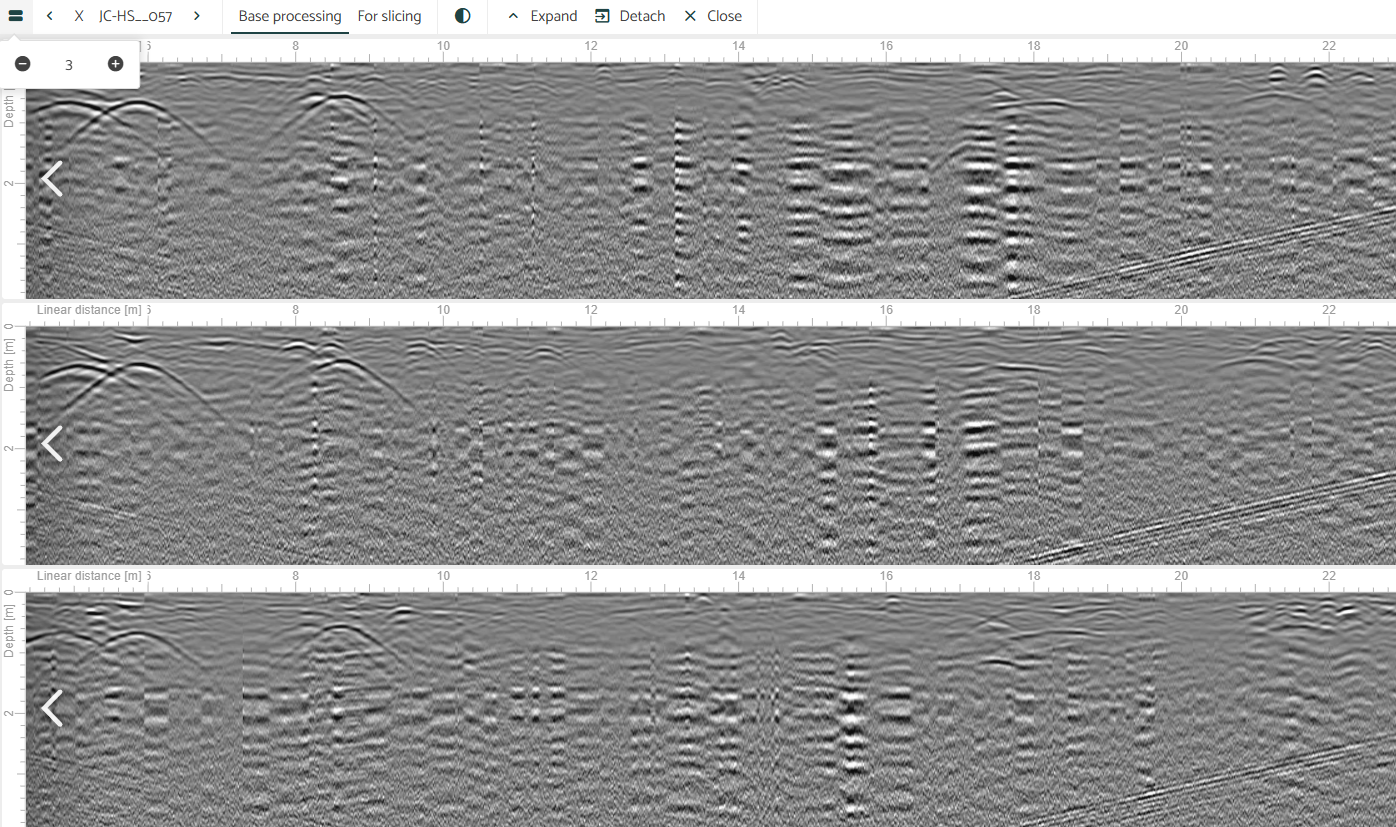
The profiles are aligned horizontally, making it simple to track features from one profile to the next - particularly useful for utility mapping and complex bridge deck analysis projects. Profile order follows the sequence listed in the Import tab of the GPR layer. Navigate through the stacked profiles using the on-screen buttons or keyboard shortcuts Alt+1 and Alt+2, with the stack updating automatically as you scroll through available GPR files.